A 62-location franchise operator running Jimmy John's, Dunkin', and Baskin-Robbins had all the data it needed locked inside CrunchTime — but no way to see across brands, no automated scorecards, and no visibility into where food cost was leaking.
Knight Digital Partners built an integration and analytics layer on top of CrunchTime that pulls sales, labor, and food cost automatically every night, unifies three brands into one operating picture, and puts an exception-driven command center in front of every operator — from store manager to owner.
Results at a Glance
The Client
Summit Restaurant Group operates 62 quick-service restaurants across four states — 34 Jimmy John's, 22 Dunkin', and 6 Baskin-Robbins — generating roughly $140M in annual system sales. Like most multi-unit franchisees at this scale, Summit already ran its back-of-house on CrunchTime (net-chef): inventory, purchasing, recipes, labor, and food cost all lived there, brand by brand.
The data existed. Getting decisions out of it was the problem.
The Challenge — Data-Rich, Insight-Poor
Every operator who has scaled past ~20 stores knows this wall. CrunchTime is excellent at running a restaurant's back office, but a growing franchisee needs something it isn't designed to be: a cross-brand, executive-grade reporting layer. Summit's leadership was living with the symptoms:
Siloed by brand
Jimmy John's, Dunkin', and Baskin-Robbins each reported separately. There was no single number for "how did the whole portfolio do this week?"
Scorecards built by hand
District managers spent hours every week exporting reports and reassembling them into spreadsheets. By the time leadership reviewed them, the numbers were days stale.
Food-cost variance was invisible
Actual food cost was known; what the food should have cost — the theoretical — wasn't calculated. So waste, over-portioning, and shrink hid in plain sight.
Labor problems surfaced too late
Overtime and labor-percentage overages were caught after payroll ran, not while there was still time to act.
No standard
Every district measured success a little differently, which made accountability and coaching inconsistent.
None of this is a CrunchTime shortcoming — it's the gap between a back-office system of record and the operating intelligence a multi-unit operator needs to run the business.
What We Built
A custom analytics platform that sits on top of CrunchTime and turns it into a decision-making tool. Five pieces:
1. An automated nightly integration with CrunchTime
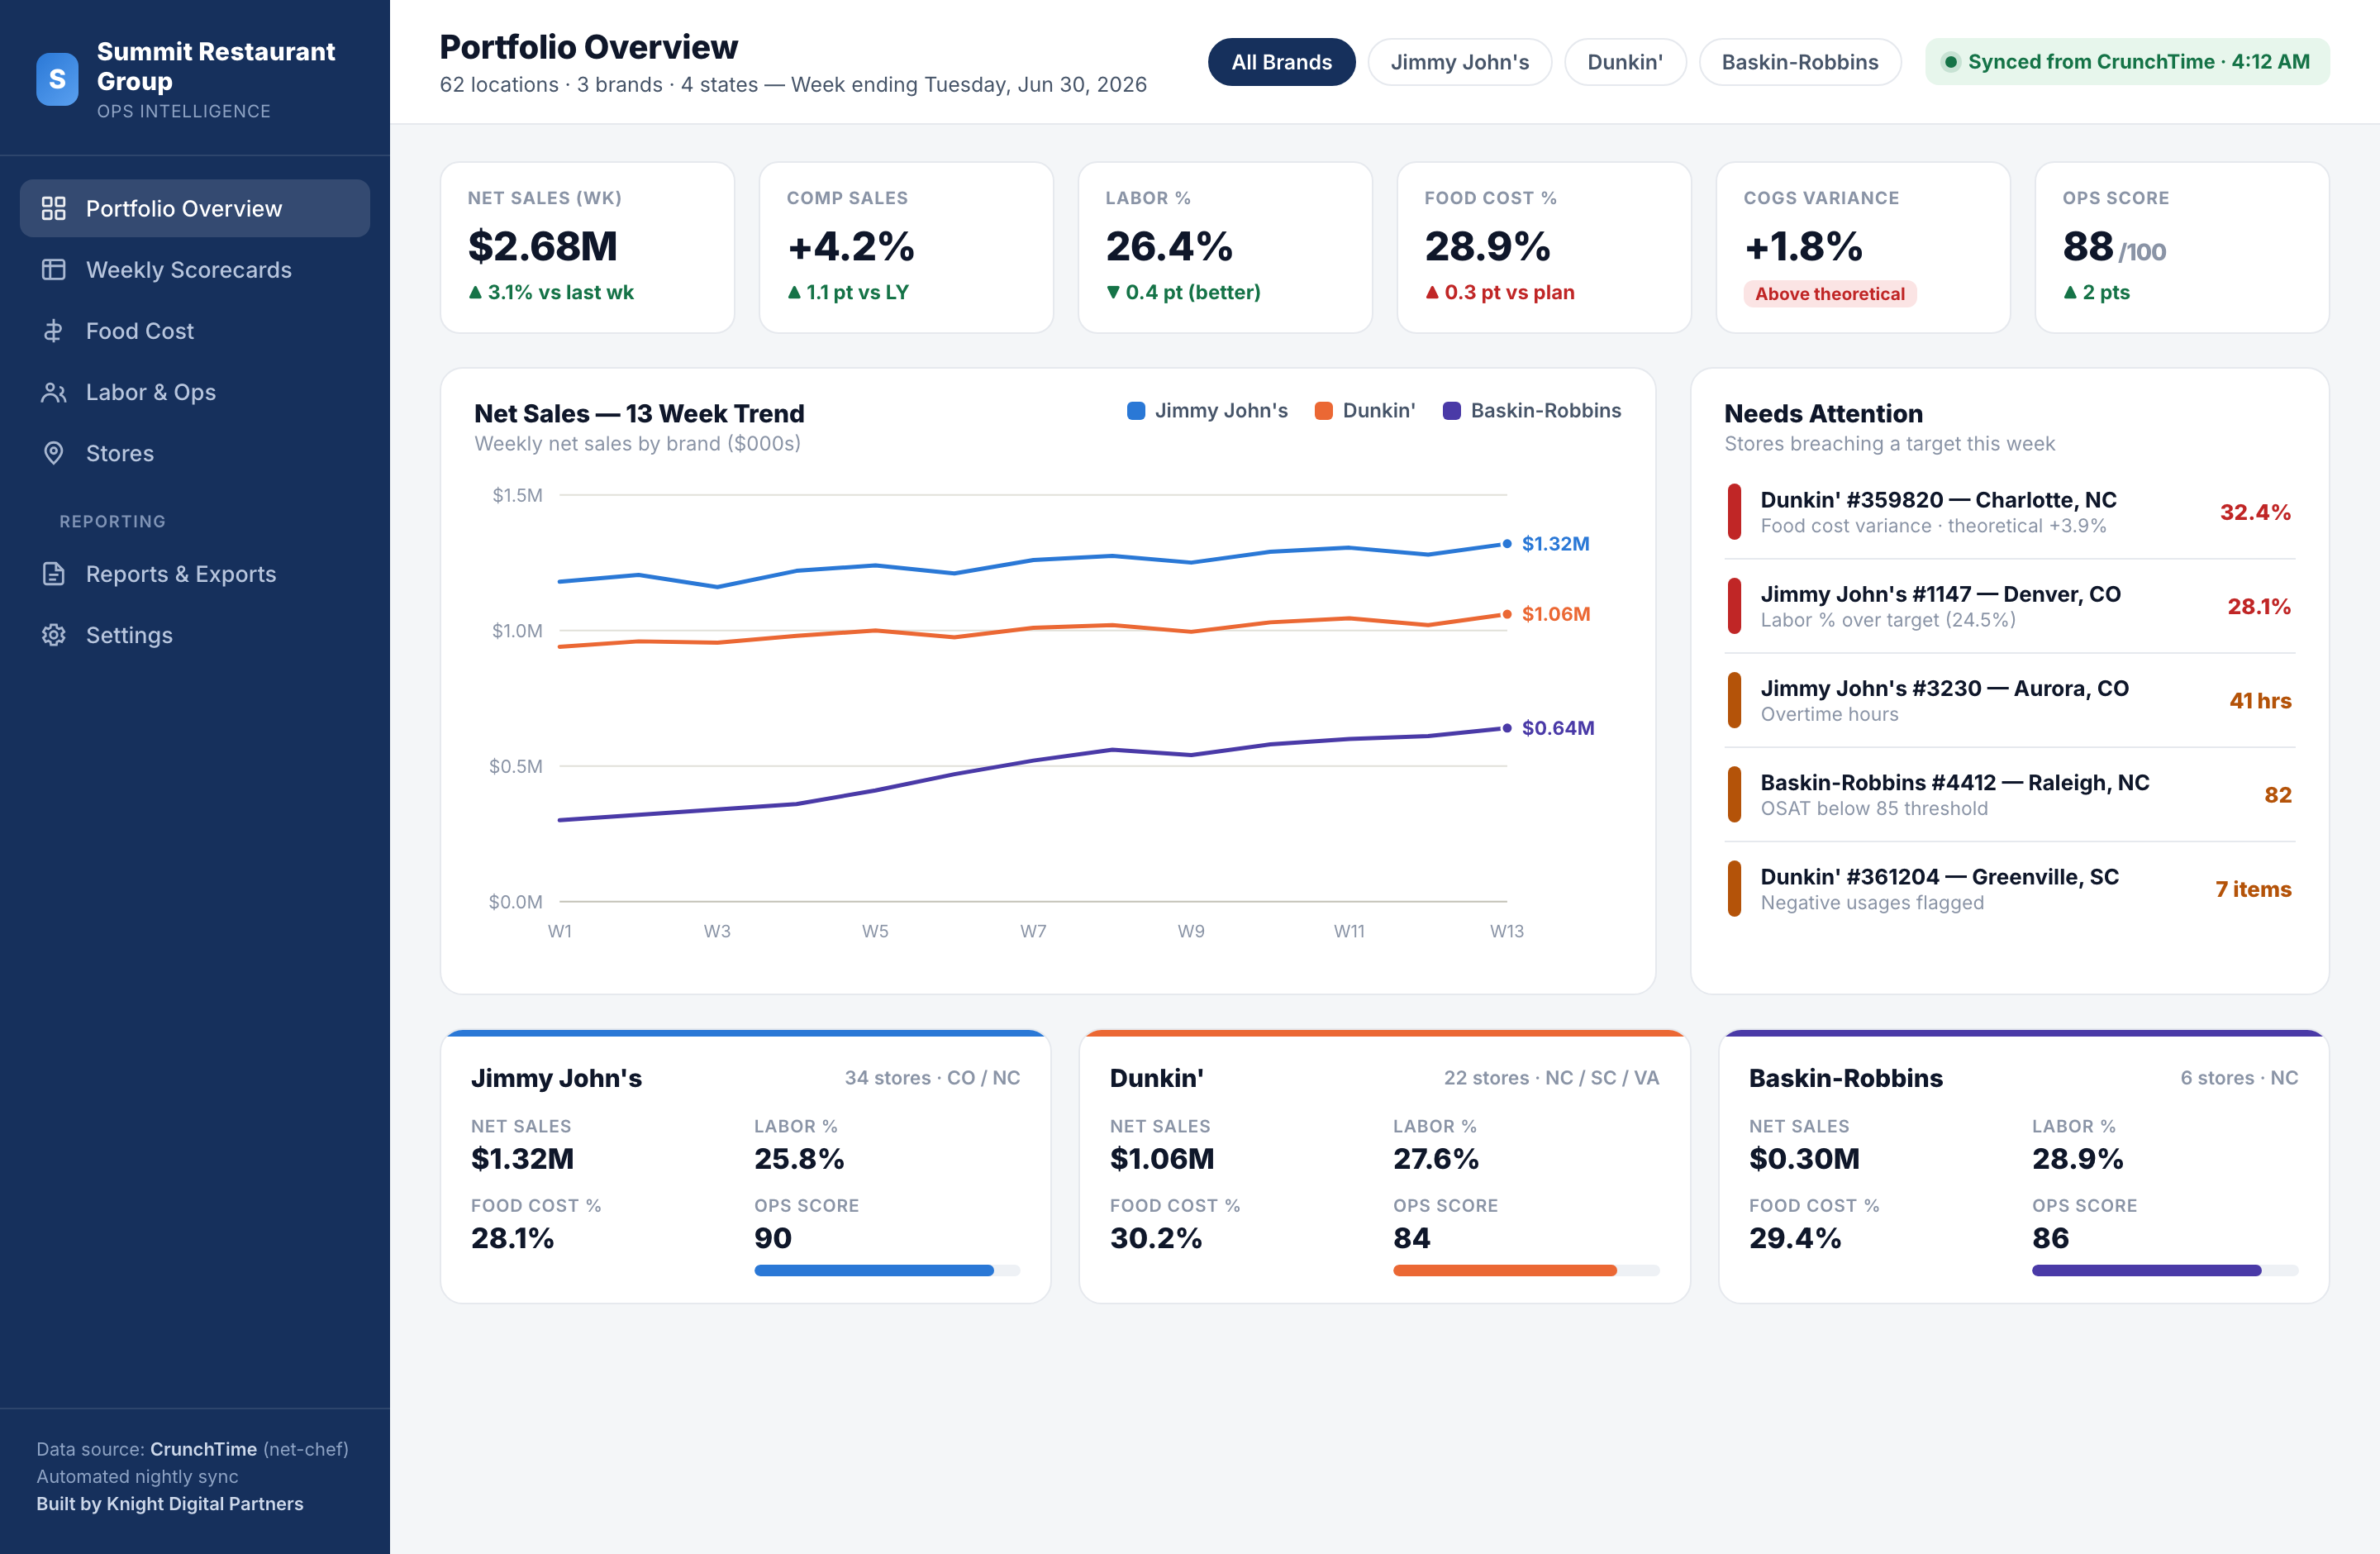
We connect directly to the CrunchTime API and pull the operational data every night — sales, transactions, labor, overtime, and both actual and theoretical food cost — with no manual exports. Each morning, the numbers for the week are simply there, tagged by source, with a built-in safety net: the sync only fills blanks or updates values it previously wrote, so anything a manager entered by hand is never overwritten. On the dashboard above, note the green "Synced from CrunchTime · 4:12 AM" badge — leadership opens the platform to a complete, current picture before the first store opens.
2. A unified data model across every brand and store
We map all 62 locations into a single organizational hierarchy — State → Region → District → Store — so the same metric rolls up cleanly whether you're an owner looking at the whole portfolio or a district manager looking at four stores. Three brands, one language.
3. Automated weekly scorecards
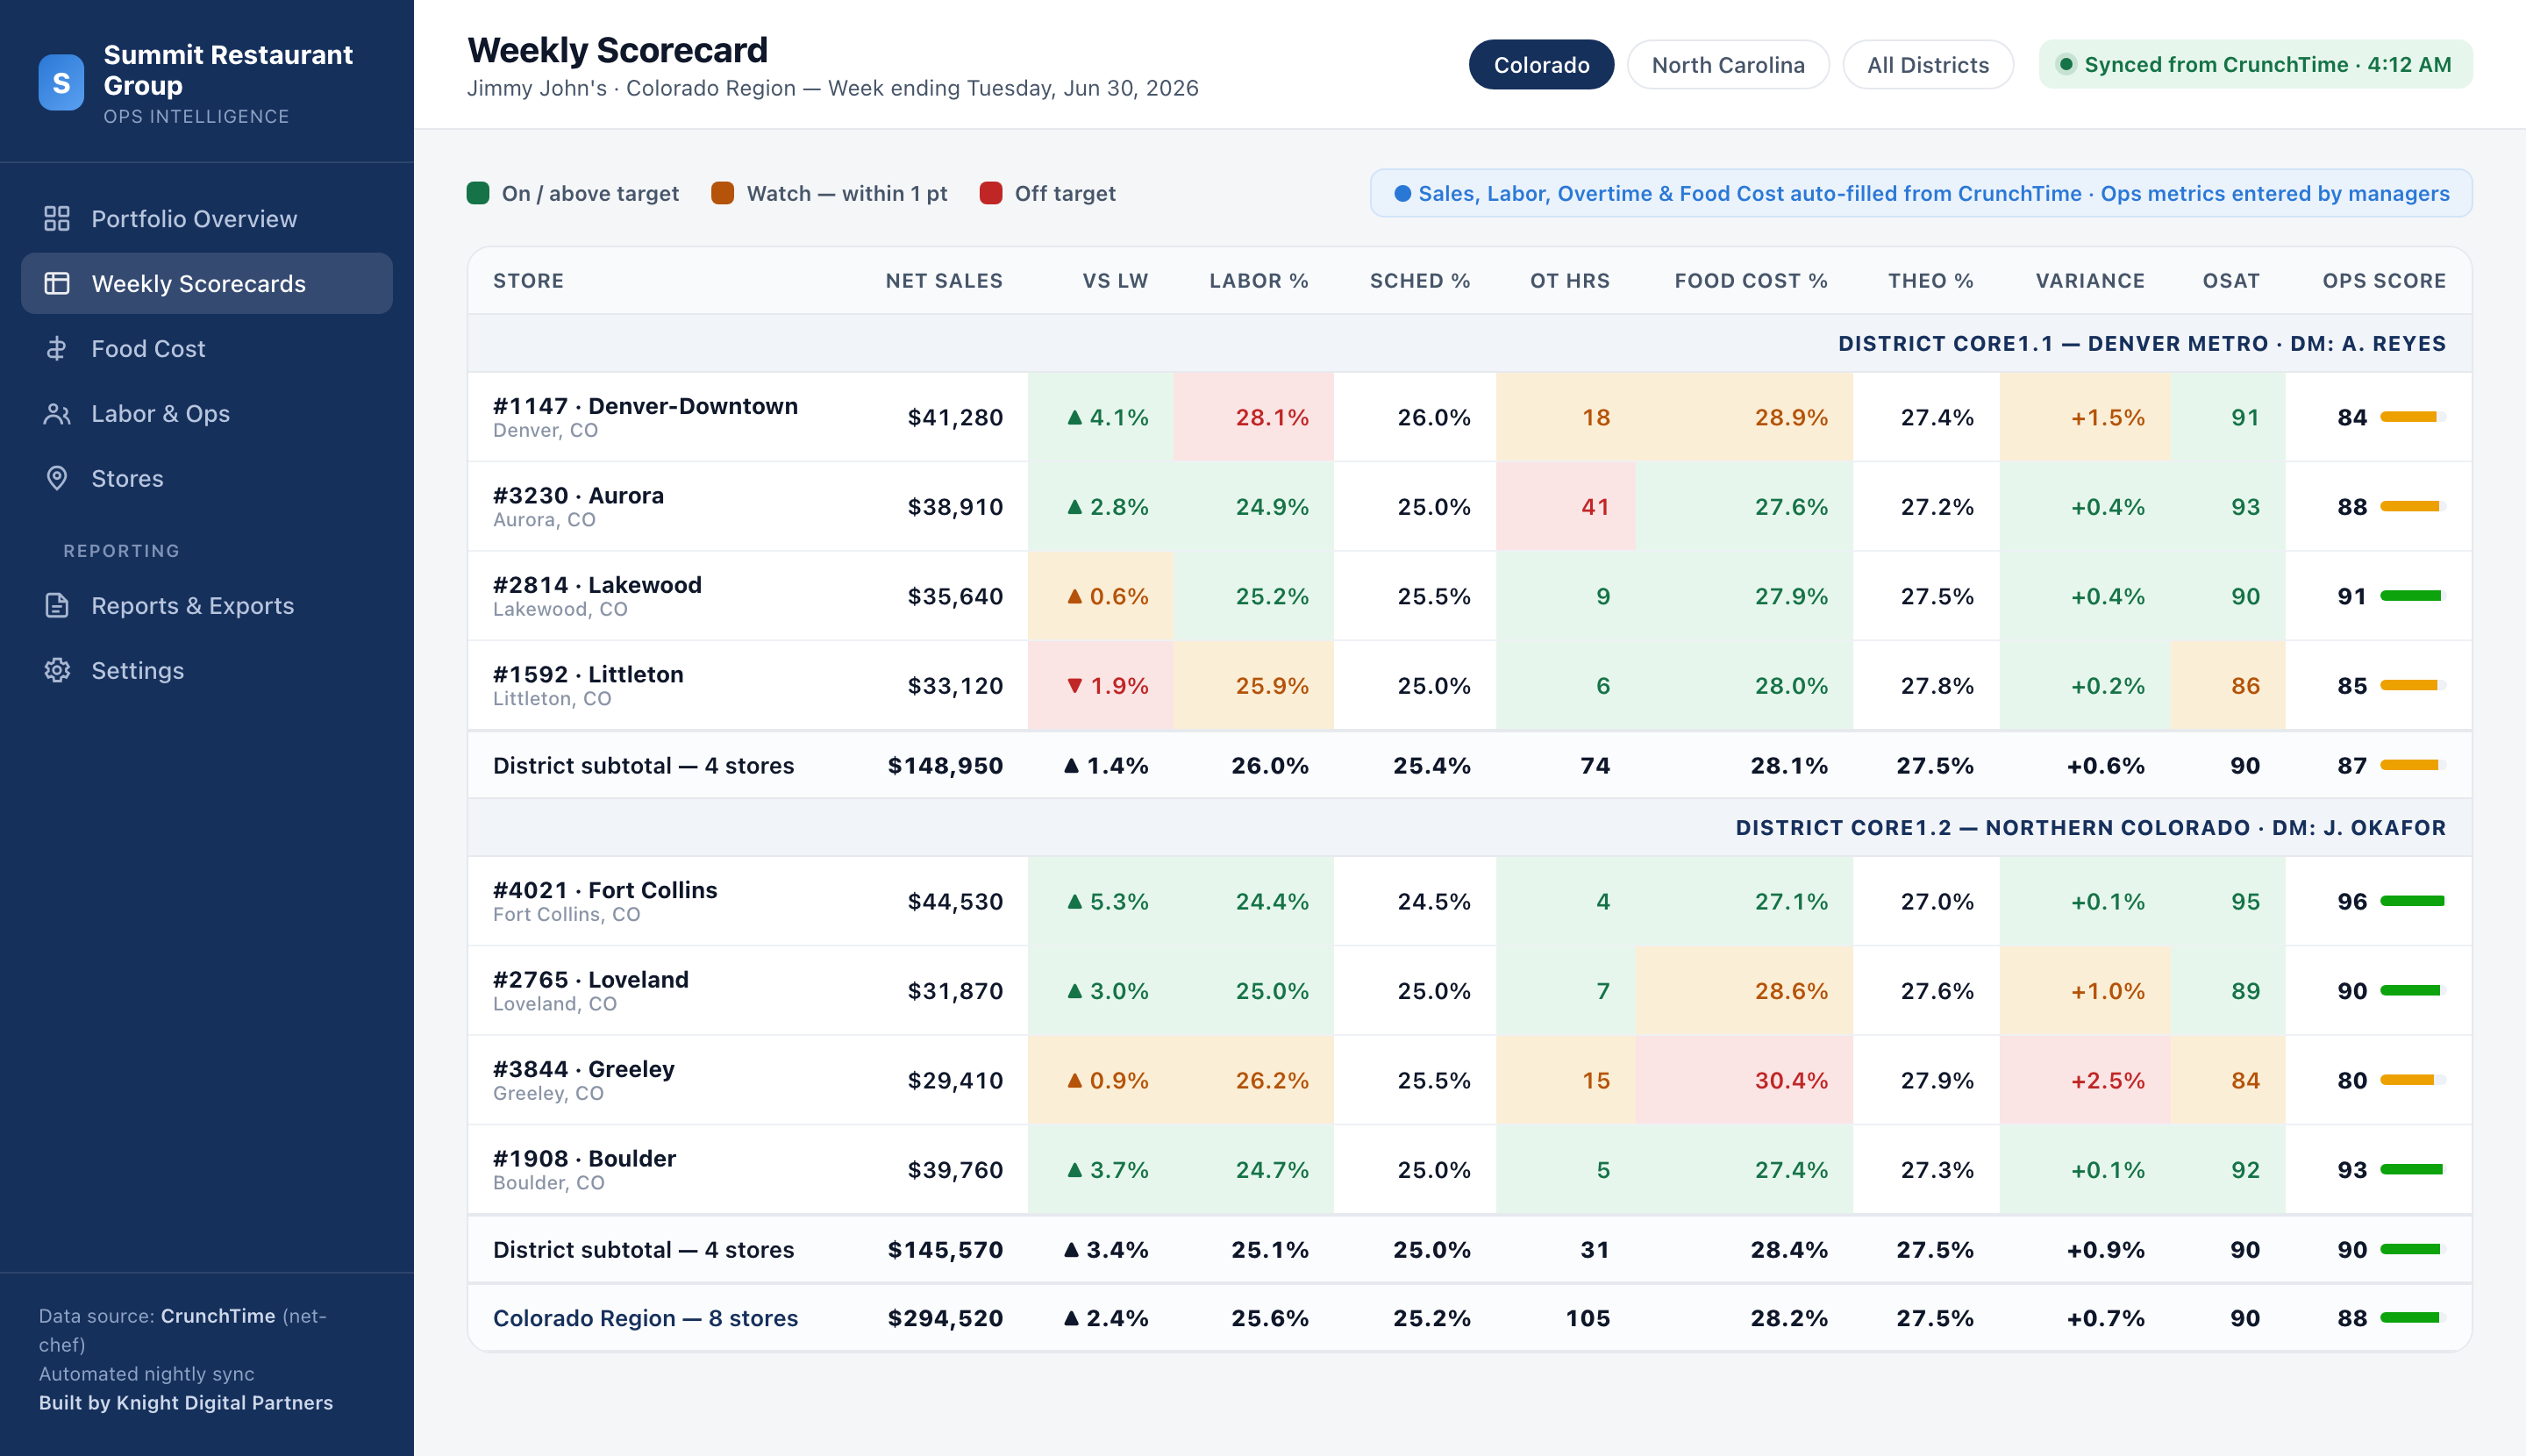
The manual spreadsheet is gone. Every store gets a weekly scorecard with targets and red / amber / green status on every metric — sales, labor, overtime, food cost, variance, customer experience, and a composite Ops Score — so an operator sees exactly where to look in seconds.
4. A food-cost intelligence engine
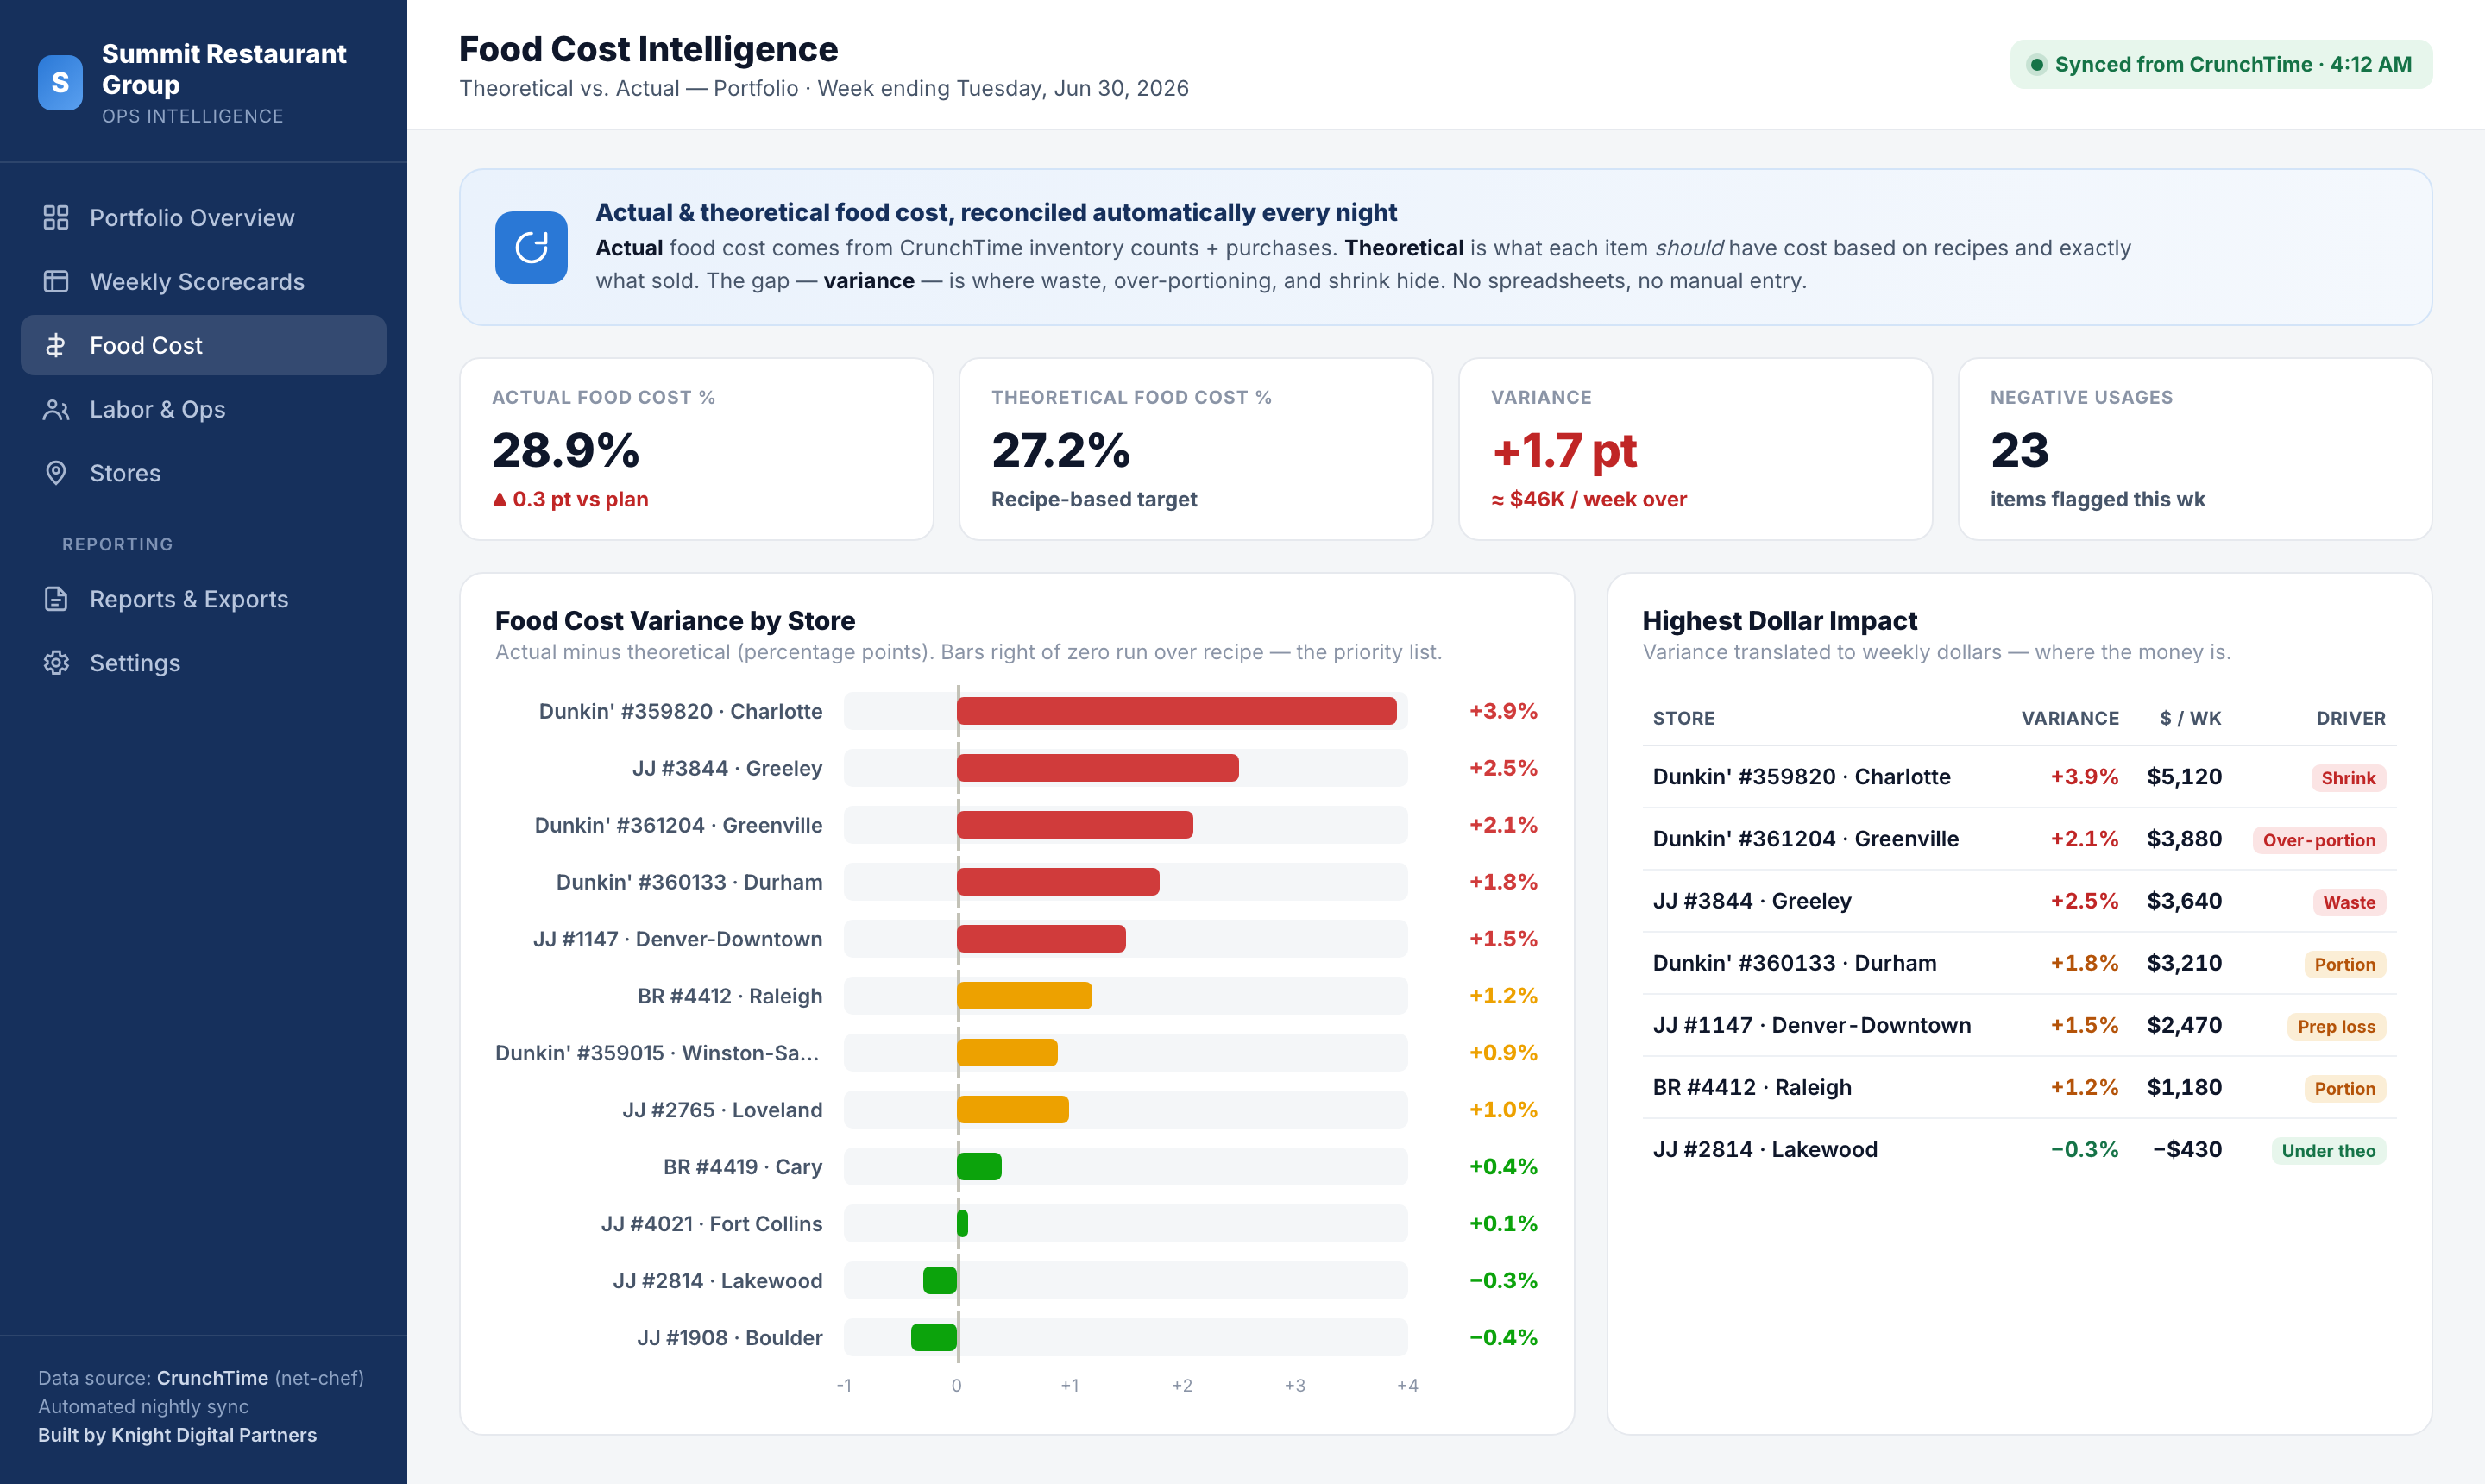
This is where the biggest dollars hide. We compute theoretical food cost — what each item should have cost, based on its recipe and exactly what sold — and reconcile it against actual food cost from CrunchTime inventory counts and purchases. The gap between them, the variance, is a direct readout of waste, over-portioning, and shrink, ranked by dollar impact so operators fix the biggest leaks first.
5. Labor and operations leaderboards
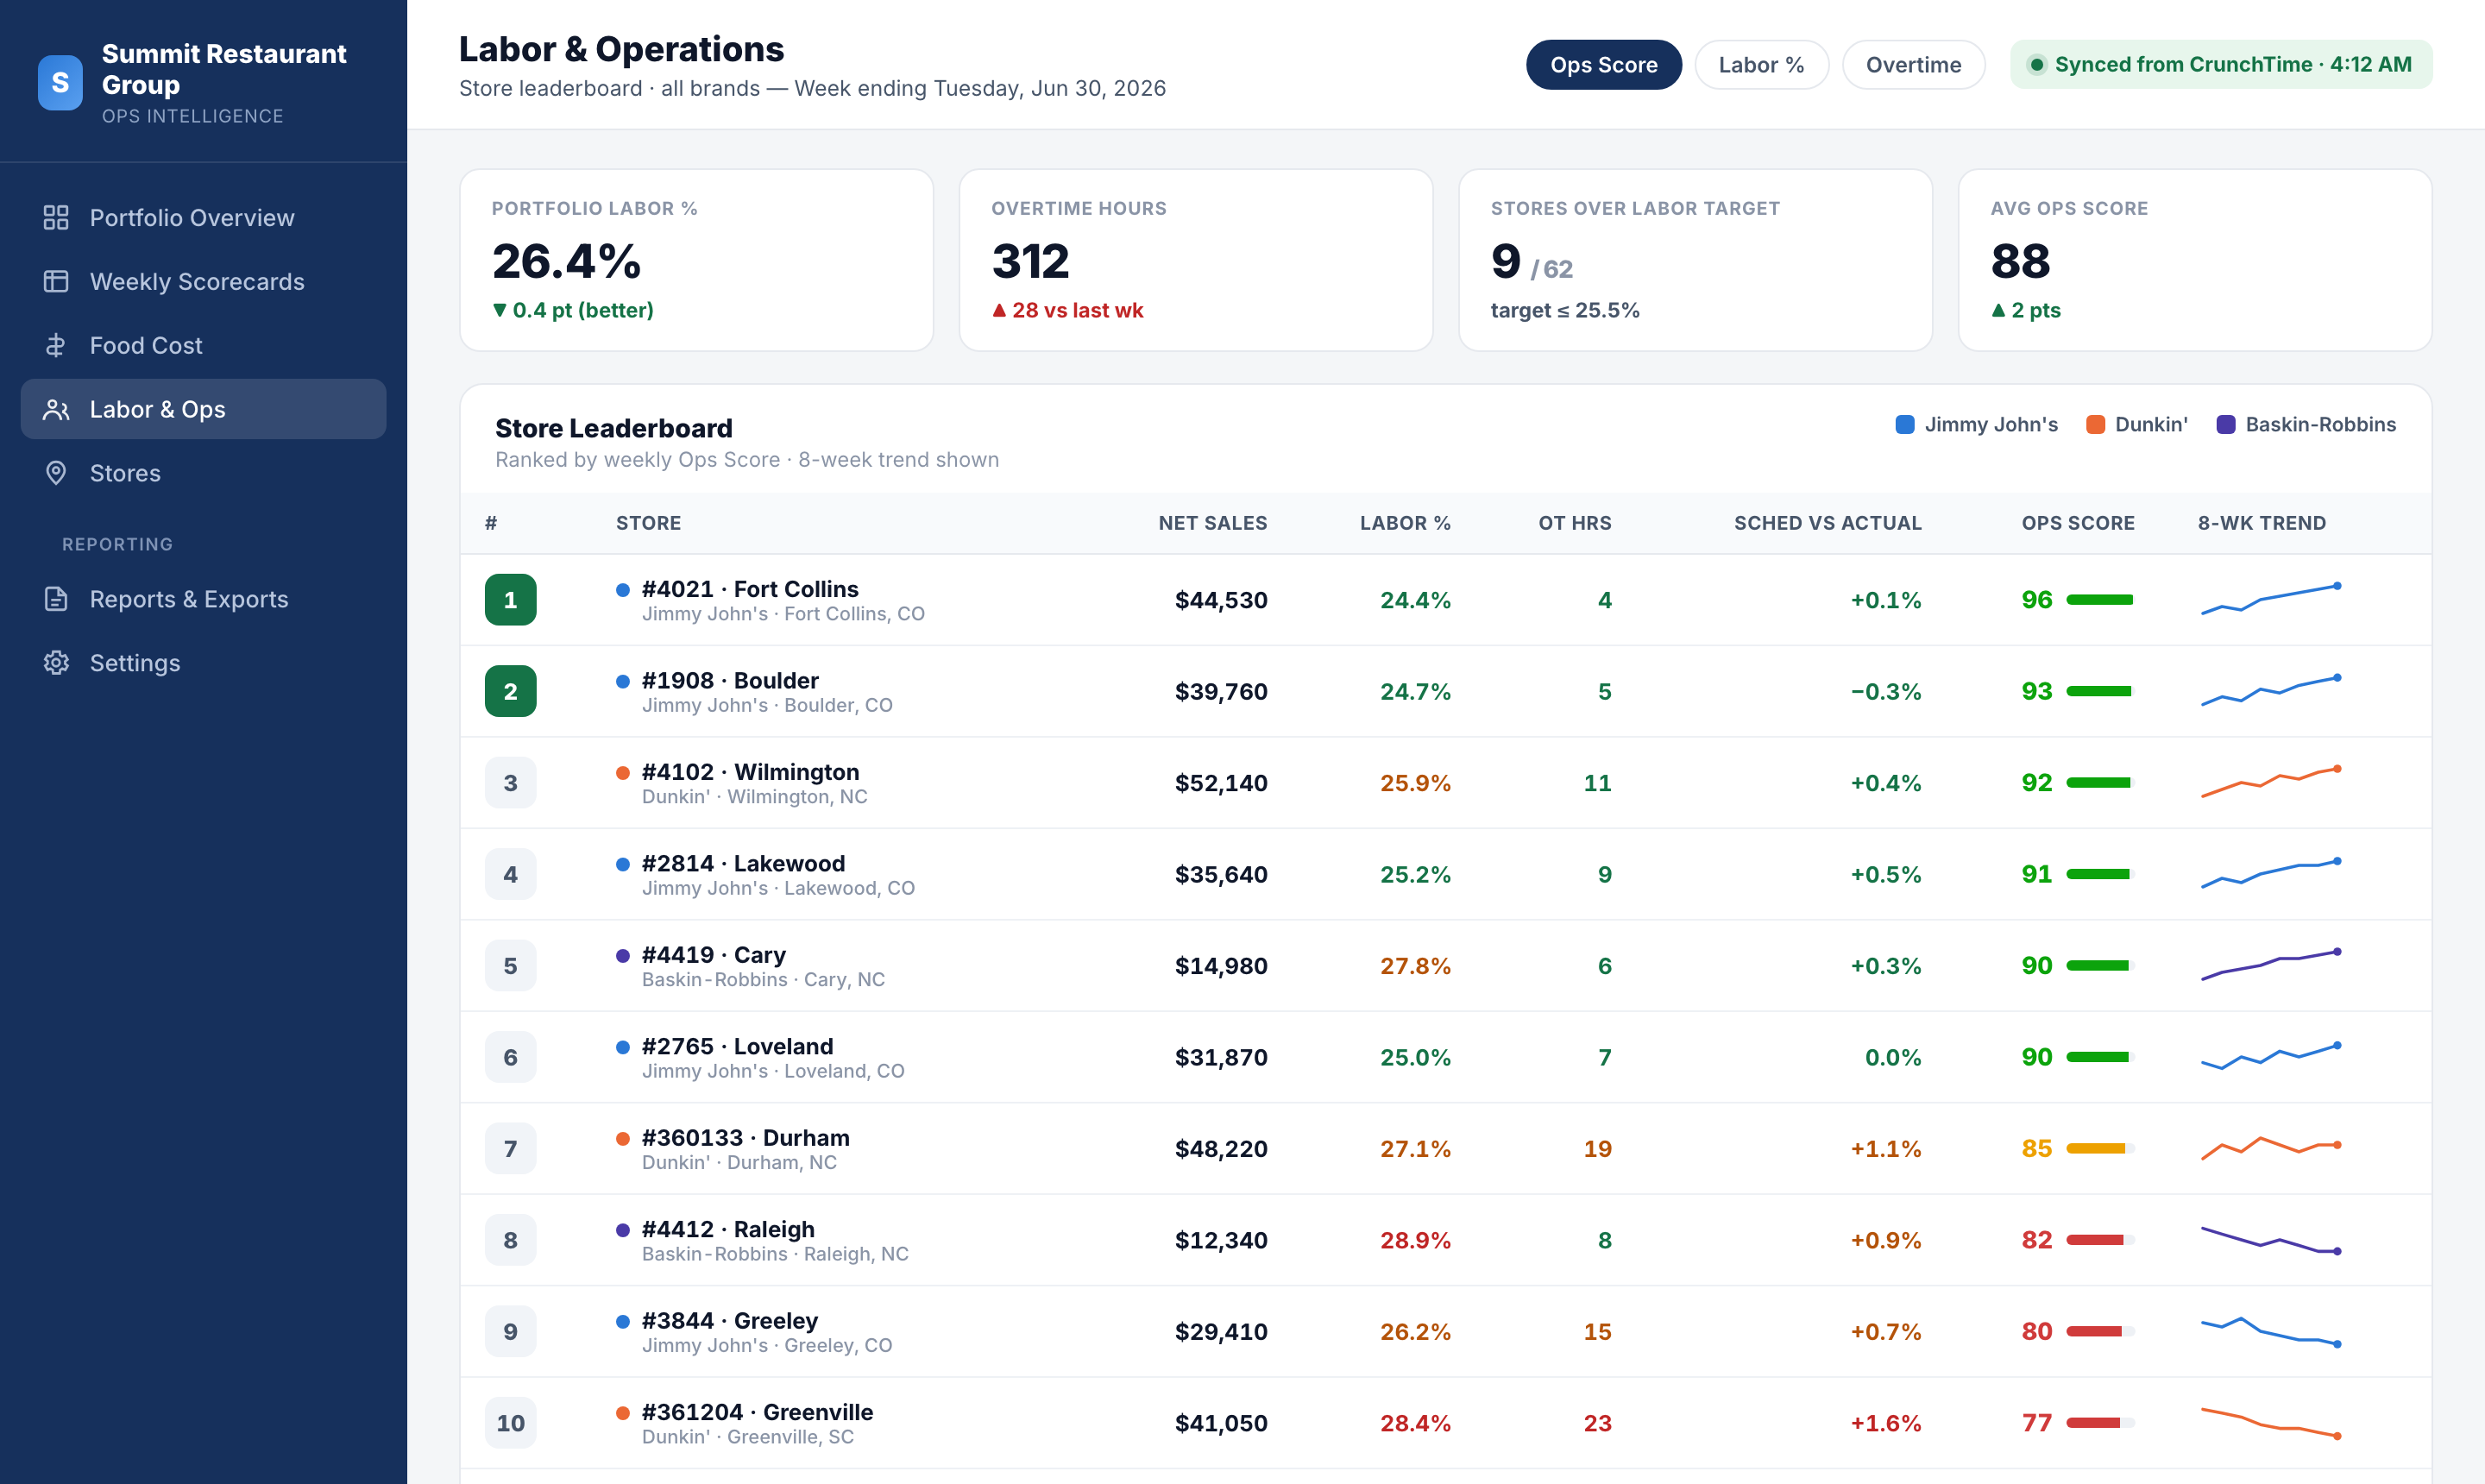
Finally, we make performance visible and comparable. A single leaderboard ranks every store by Ops Score with labor percentage, overtime, schedule adherence, and an 8-week trend line — turning "how are we doing?" into a ranked, coachable list.
Why This Matters for Operators With 20+ Stores
Below ~20 units, an owner can hold the business in their head and a spreadsheet. Past that, complexity compounds faster than headcount — and that's exactly where an automated analytics layer stops being a nice-to-have. Here's where it pays, with illustrative figures based on Summit's ~$140M in system sales.
Recover food-cost margin you can't currently see
Summit ran +1.7 points of food-cost variance above theoretical — roughly $46,000 per week, or ~$2.4M a year, of food cost above what the recipes say it should be. You cannot fix what you cannot see. By surfacing variance store-by-store and ranking it by dollars, operators can attack the worst offenders (a single Dunkin' running +3.9%) instead of guessing. Recovering even a third of that variance is ~$800K a year.
Protect labor margin in-week, not after payroll
At $140M in sales, one point of labor is ~$1.4M. Catching overtime and labor overages while the week is still open — instead of discovering them after payroll — routinely returns a fraction of a point across a fleet. A 0.3-point improvement is ~$420K a year, and it comes from visibility alone.
Give back hundreds of district-manager hours
When scorecards build themselves, district managers stop being data-entry clerks and go back to running restaurants. Across a district team, eliminating a few hours of manual reporting per manager per week adds up to well over a thousand hours a year redirected from spreadsheets to the floor.
Make speed a competitive advantage
The week closes Tuesday; the complete, cross-brand picture is ready before dawn Wednesday — not on Friday afternoon. Decisions happen days earlier, while there's still a week to influence.
Manage by exception, across every brand at once
Instead of reading 62 reports, leadership reads one "Needs Attention" list. The platform elevates only the stores breaching a target — a food-cost outlier here, an overtime spike there — so executive attention lands where it changes the number. Three brands, four states, one screen.
Standardize accountability as you grow
One scorecard, one Ops Score, one definition of "good" across every brand and district makes coaching consistent and performance comparable — and it means the next acquisition or new-store opening plugs into the same system on day one, with no new analysts to hire.
The Results
Why CrunchTime + a Custom Analytics Layer
CrunchTime is the right system of record for a serious QSR operator — it runs the back office. What it isn't built to be is your cross-brand executive reporting layer, your automated scorecard, or your theoretical-vs-actual food-cost engine tuned to your targets and your org structure.
That's the layer we build. We meet CrunchTime through its API, respect it as the source of truth, and turn its data into the dashboards, scorecards, and alerts your operators actually run the business on — customized to how your company is organized and what your leadership needs to see.
Operating 20+ QSR locations on CrunchTime?
If your team is still assembling scorecards by hand or flying blind on food-cost variance, we can help. We build the integration, the data model, and the dashboards — you get an operations command center tailored to your business.
Let's talk about your operation →Client name anonymized and all figures illustrative and representative of the engagement; dashboards shown are functional mockups using sample data. Brand names (Jimmy John's, Dunkin', Baskin-Robbins) refer to real CrunchTime-using QSR concepts and imply no endorsement.